Plan Progress shows where you are on your weight goal timeline, how the current week is behaving, and whether the projected goal date still fits the evidence Fuel has.
01What it shows
Plan Progress lives on the You tab under Your Plan. That makes it part of the same long-range hub as Year to Date Stats, badges, reports access, weight, and plan settings.
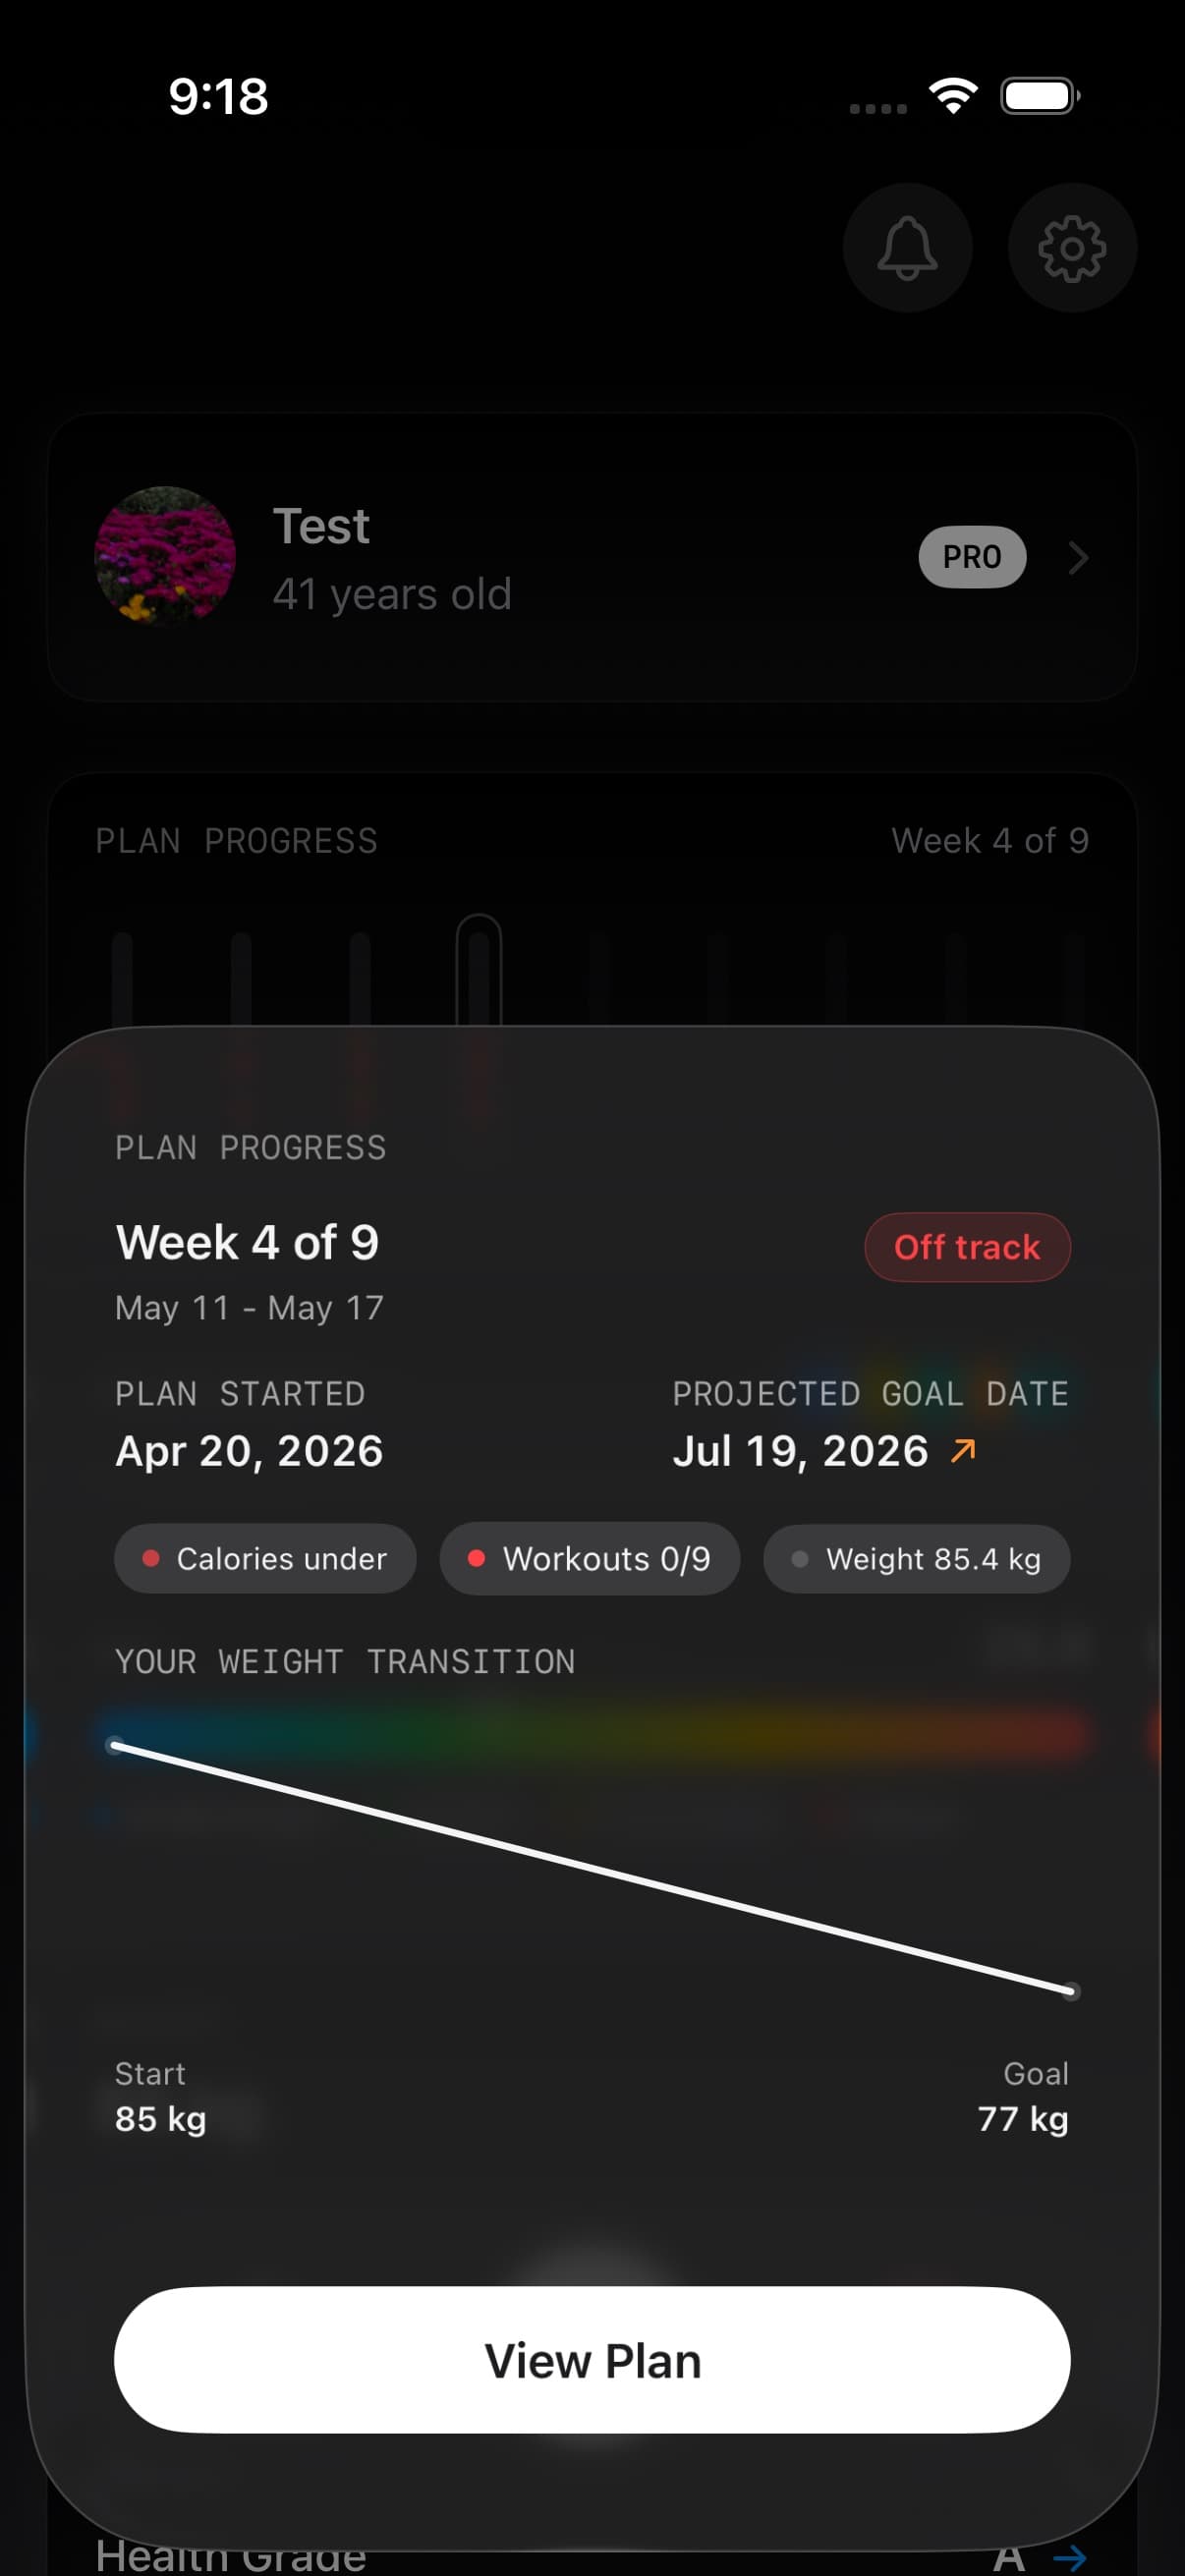
The compact You-tab card shows the current plan week, status, and a horizontal week strip. Opening it gives you the week-level detail behind the badge.
Projected Weight Timeline displays a line chart from your start weight to your goal weight with an estimated completion date. The projection is based on your plan calories, your maintenance calories, and a standard energy balance model. The chart uses a smoothed curve to reflect how weight change can slow as you approach your goal.
Goal Timeline Delta compares two timelines side by side: your projected progress with Fuel and an estimate without structured tracking. Treat it as a planning comparison, not a guarantee that the future will follow the chart exactly.
02What drives projections
The projection uses your daily calorie target, your estimated maintenance calories (TDEE), and a standard conversion factor to translate energy balance into expected weight change per week.
Three inputs matter most:
- Plan calories vs maintenance. The gap between what you eat and what you burn defines the weekly rate of change.
- Weigh-ins. Regular weigh-ins anchor the projection to your actual progress rather than a theoretical curve.
- Activity data. If you use Dynamic Calories, your activity level adjusts the daily target, which flows through to the projection.
03Weekly status
Plan Progress also shows a weekly status badge: on track, close, off track, getting started, or not enough data. This status reflects how your actual week compared to your plan across calories, workouts, and weight.
The same status feeds into Weekly Review and Reports, so coaching and report rows can reference the same calorie, activity, and weight signal.
04Faster first view
Plan Progress can show your last known display-ready state quickly when you reopen Fuel, then refresh with the latest logs, workouts, weigh-ins, and plan metadata in the background. If the cached state is not good enough to display, Fuel falls back to a loading strip rather than showing weak or misleading week bars.
Use Fuel Energy Model when you want to understand how daily targets, burn baseline, Dynamic TDEE, weigh-ins, and data quality feed the progress signal.
05When projections shift
Projections are estimates. They can shift when maintenance calories change, when you adjust plan targets, when the week has more complete food or activity data, or when your weigh-in trend diverges from the projected curve.
If the projected date keeps moving further out, the usual cause is inconsistent adherence, sparse data, or a target that no longer fits the week you are actually living. Use Weekly Review or Ask your assistant to talk through whether plan speed, logging coverage, or targets need adjustment.
If GLP-1 Support is enabled, appetite and hydration context can inform coaching, but Plan Progress still reads the same plan, food, activity, and weight evidence.
06Plan limits
Plan Progress is available to Fuel Pro subscribers. See Free and Pro for details.