Why this page exists
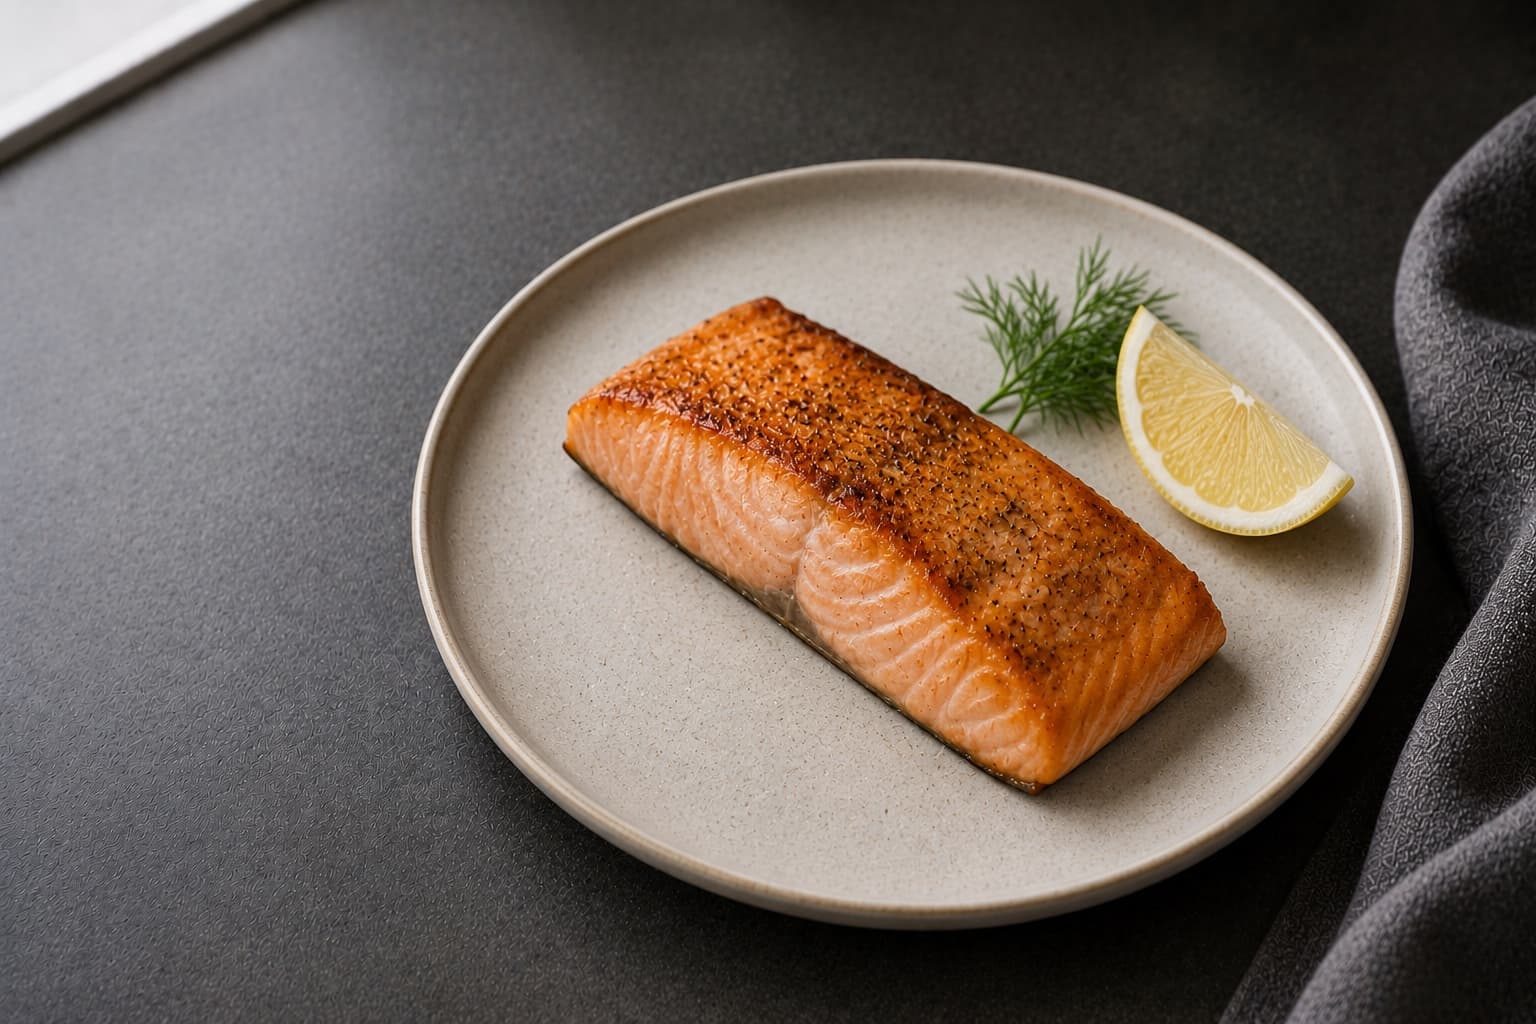
Two fish sit under one tracker entry, and they are not close. Farmed Atlantic salmon raw carries 13.1 g of fat per 100 g. Wild sockeye raw carries 4.9 g. That is close to two and a half times as much fat, and it drags the calorie count with it: 197 kcal per 100 g for farmed against 130 kcal for wild. A reader who logs "salmon" without specifying which one is off by roughly 67 kcal per 100 g before they have added a single side dish.
This is the best-supported comparison on this page, because all four records here carry it. Farmed and wild both appear raw and both appear cooked, so the gap is not an assumption about what cooking does to salmon. It is a measured difference at every state the USDA recorded.
What is in a serving
Every figure below is scaled from the USDA record named at the bottom of this panel.
Serving basisgrams
100 gof Atlantic farmed, raw
- Calories
- 197 cal
- Protein
- 20.3 g
- Carbs
- 0 g
- Fat
- 13.1 g
| Nutrient | Per serving100 g | Per 100 greference |
|---|---|---|
| Calories | 197 cal | 197 cal |
| Protein | 20.3 g | 20.3 g |
| Carbs | 0 g | 0 g |
| Fat | 13.1 g | 13.1 g |
| Fiber | not reportedUnavailable. This record does not report fiber. | not reportedUnavailable. This record does not report fiber. |
| Sugar | not reportedUnavailable. This record does not report sugar. | not reportedUnavailable. This record does not report sugar. |
| Sodium | 50 mg | 50 mg |
Fiber and Sugar are not reported on Atlantic farmed, raw.
A nutrient the record does not measure shows as — and never as 0. A zero here is a measured zero.
FDC 2684441USDA Foundation FoodsFish, salmon, Atlantic, farm raised, rawPublished April 18, 2024
The records behind this page
One food family, 4 source records. The figures are per 100 g, which is the basis the USDA publishes and the only fair way to compare records whose servings differ.
| Record | Caloriescal | Proteing | Carbsg | Fatg | Fiberg | Sugarg | Sodiummg |
|---|---|---|---|---|---|---|---|
| Fish, Salmon, Atlantic, Farm Raised, RawFDC 2684441FoundationRawShown by default | 197 | 20.3 | 0 | 13.1 | not reportedUnavailable. This record does not report fiber. | not reportedUnavailable. This record does not report sugar. | 50 |
| Fish, Salmon, Sockeye, Wild Caught, RawFDC 2684440FoundationRaw | 130 | 22.3 | 0 | 4.9 | not reportedUnavailable. This record does not report fiber. | not reportedUnavailable. This record does not report sugar. | 53 |
| Fish, Salmon, Atlantic, Farmed, Cooked, Dry HeatFDC 175168SR LegacyCooked | 206 | 22.1 | 0 | 12.4 | 0 | 0 | 61 |
| Fish, Salmon, Sockeye, Cooked, Dry HeatFDC 173692SR LegacyCooked | 156 | 26.5 | 0 | 5.6 | 0 | 0 | 92 |
Logging salmon without guessing
Farmed and wild are different foods, not different labels on the same food. Per 100 g raw, farmed Atlantic runs 197 kcal, 20.3 g protein, and 13.1 g fat. Wild sockeye runs 130 kcal, 22.3 g protein, and 4.9 g fat. Wild carries slightly more protein and much less fat, which means the calorie gap is almost entirely a fat story. If your grocery receipt says "farmed" or "wild," or the package says "Atlantic" versus "sockeye," that word is the input your tracker needs. A generic "salmon" entry is picking one of these two foods for you, silently.
The gap survives cooking, and cooking adds its own shift. Cooked farmed Atlantic runs 206 kcal, 22.1 g protein, and 12.4 g fat per 100 g. Cooked sockeye runs 156 kcal, 26.5 g protein, and 5.6 g fat. Both records gain calories and protein per 100 g relative to their raw state, which is what happens when moisture cooks off and the remaining flesh concentrates. The farmed-versus-wild fat gap narrows only slightly, from 8.2 g raw to 6.8 g cooked. Weigh raw before cooking if you want the number on the package to mean something, or weigh the cooked portion and log the cooked record. Do not weigh raw and log the cooked record's calories against it.
Match the record to the state you actually weighed. The two cooked records here carry restaurant-style portions: a 3 oz serving at 85 g, and a half fillet at 178 g for farmed or 155 g for sockeye. A 3 oz cooked portion of farmed Atlantic is a meaningfully different number than 85 g of raw fillet, because cooked salmon has already lost water weight the raw record has not. If you weigh your plate after cooking, log against 175168 or 173692. If you weigh the fillet before it goes in the pan, log against 2684441 or 2684440.
Two claims this page will not make. Canned salmon is a common budget swap, and this page has no canned record to put a number on it. Skin-on fillets carry more fat than skinless, and this page has no skin-on record to quantify how much. Both are real questions with no answer here. Weigh what you are actually eating and pick the closest state and cut this page does cover, which is fillet, farmed or wild, raw or cooked.
Sodium moves with cooking too. Raw farmed sits at 50 mg per 100 g and raw wild at 53 mg. Cooked farmed rises to 61 mg and cooked sockeye to 92 mg, both per 100 g with no added salt in the USDA preparation. None of these are meal-plan-breaking numbers on their own, but they explain why a pan-seared fillet with a soy-based glaze reads much higher in a tracker than the fish alone would suggest. The sodium in the sauce is a separate line item.
Where salmon fits, and where the cost argument is real
The omega-3 case, without a number this page's table can display. Salmon is the food on this site that pairs a full protein serving with a meaningful EPA and DHA dose. The checked-in USDA source records retain EPA and DHA fields, but this page's macro table does not surface them, so this page will not print a gram figure from a field it does not display. What it can tell you is the fat total, and that farmed carries more of it than wild at every state measured. For the mechanism and the target range, use omega-3 fatty acids and the omega-3 index rather than a number invented here.
Recovery framing, kept to what is measured. Post-training inflammation modulation is a real area of research, and it belongs at recovery time rather than as a vague claim on a food page. What this page contributes is the protein and fat numbers a recovery meal is built from, not the physiology.
The practical version is a bowl, not a fillet on a plate. The salmon rice bowl is where the farmed-versus-wild choice, the raw-versus-cooked weighing question, and a carb source come together into one loggable entry. Build the fillet decision there rather than re-deriving it every time you cook.
Cost is a real constraint, and salmon does not win on it. Wild sockeye and farmed Atlantic both cost more per gram of protein than chicken breast or canned tuna, and this page will not pretend otherwise. If the omega-3 dose is the goal and the budget is tight, tuna is the cheaper source worth checking before defaulting to salmon out of habit. If the goal is protein density on a fixed grocery budget, chicken breast does that job for less money and salmon is not the tool for it. Salmon earns its place on a plate when the omega-3 dose is the specific thing being bought, not as a default protein.
Where it fits against a goal
Cutting on a tight calorie budget
115 g of Fish, Salmon, Sockeye, Wild Caught, RawFDC 2684440
- Calories
- 150 cal
- Fat
- 5.7 g
Wild sockeye at the USDA reference portion of 115 g raw carries less fat than a single farmed fillet of the same weight, and the calorie gap follows the fat gap almost exactly. If the tracker line item just says "salmon" with no type attached, you are guessing which side of that gap you landed on.
Eating enough without adding volume
115 g of Fish, Salmon, Atlantic, Farm Raised, RawFDC 2684441
- Calories
- 227 cal
- Fat
- 15.1 g
Farmed Atlantic buys extra calories in the same 115 g portion a wild fillet would occupy. For a reader who struggles to eat enough on a bulk, that is calories without a bigger plate, which is the opposite problem Greek yogurt's nonfat tub solves.
Recovery protein after hard training
155 g of Fish, Salmon, Sockeye, Cooked, Dry HeatFDC 173692
- Protein
- 41.1 g
- Calories
- 242 cal
Cooked sockeye at a half-fillet portion delivers more protein than either raw record at the same weight, because cooking concentrates the flesh as moisture cooks off. This is the record to log if you are eating a cooked half fillet straight off the pan, not the raw one.
Cooking changes the plate, not just the pan
85 g of Fish, Salmon, Atlantic, Farmed, Cooked, Dry HeatFDC 175168
- Calories
- 175 cal
- Fat
- 10.5 g
A 3 oz cooked portion of farmed Atlantic still carries most of the fat gap that separates it from wild in the raw state. Cooking narrows the calorie difference between farmed and wild slightly but does not close it.
Where this page stops short of the data
2 claims this page would like to make do not resolve to a record in the dataset. Each one carries the decision that was made about it.
Claim dropped
Per-100-g figures for canned salmon, offered as a budget variant
No record supports this, so the page does not say it. There is no estimate standing in for the missing figure.
Claim dropped
The calorie and fat difference between skin-on and skinless salmon, roughly 40 to 60 kcal per serving
No record supports this, so the page does not say it. There is no estimate standing in for the missing figure.
Methodology
Where the numbers come from
Every figure on this page is scaled from a per-100 g value in a USDA record by one shared function, so the numbers here and the numbers on a meal page that uses this ingredient cannot disagree. Values are rounded once, at the point of display.
- FDC 2684441Fish, salmon, Atlantic, farm raised, rawUSDA Foundation Foods
- FDC 2684440Fish, salmon, sockeye, wild caught, rawUSDA Foundation Foods
- FDC 175168Fish, salmon, Atlantic, farmed, cooked, dry heatUSDA SR Legacy
- FDC 173692Fish, salmon, sockeye, cooked, dry heatUSDA SR Legacy
Unavailable values
A nutrient a record does not measure is shown as unavailable and never as zero. Across the 405 records in this dataset, 165 report no fiber and 228 report no sugar, so the distinction is not a rare edge case. A zero on this page means the analysis measured zero.
Source coverage
This family has 2 recorded gaps between the editorial brief and the dataset, each shown above with the decision made about it.
Datasets
- USDA FoodData Central Foundation FoodsExport 2026-04-30 · 363 of 395 entries normalized
- USDA FoodData Central SR LegacyExport 2018-04 · 42 of 7793 entries normalized