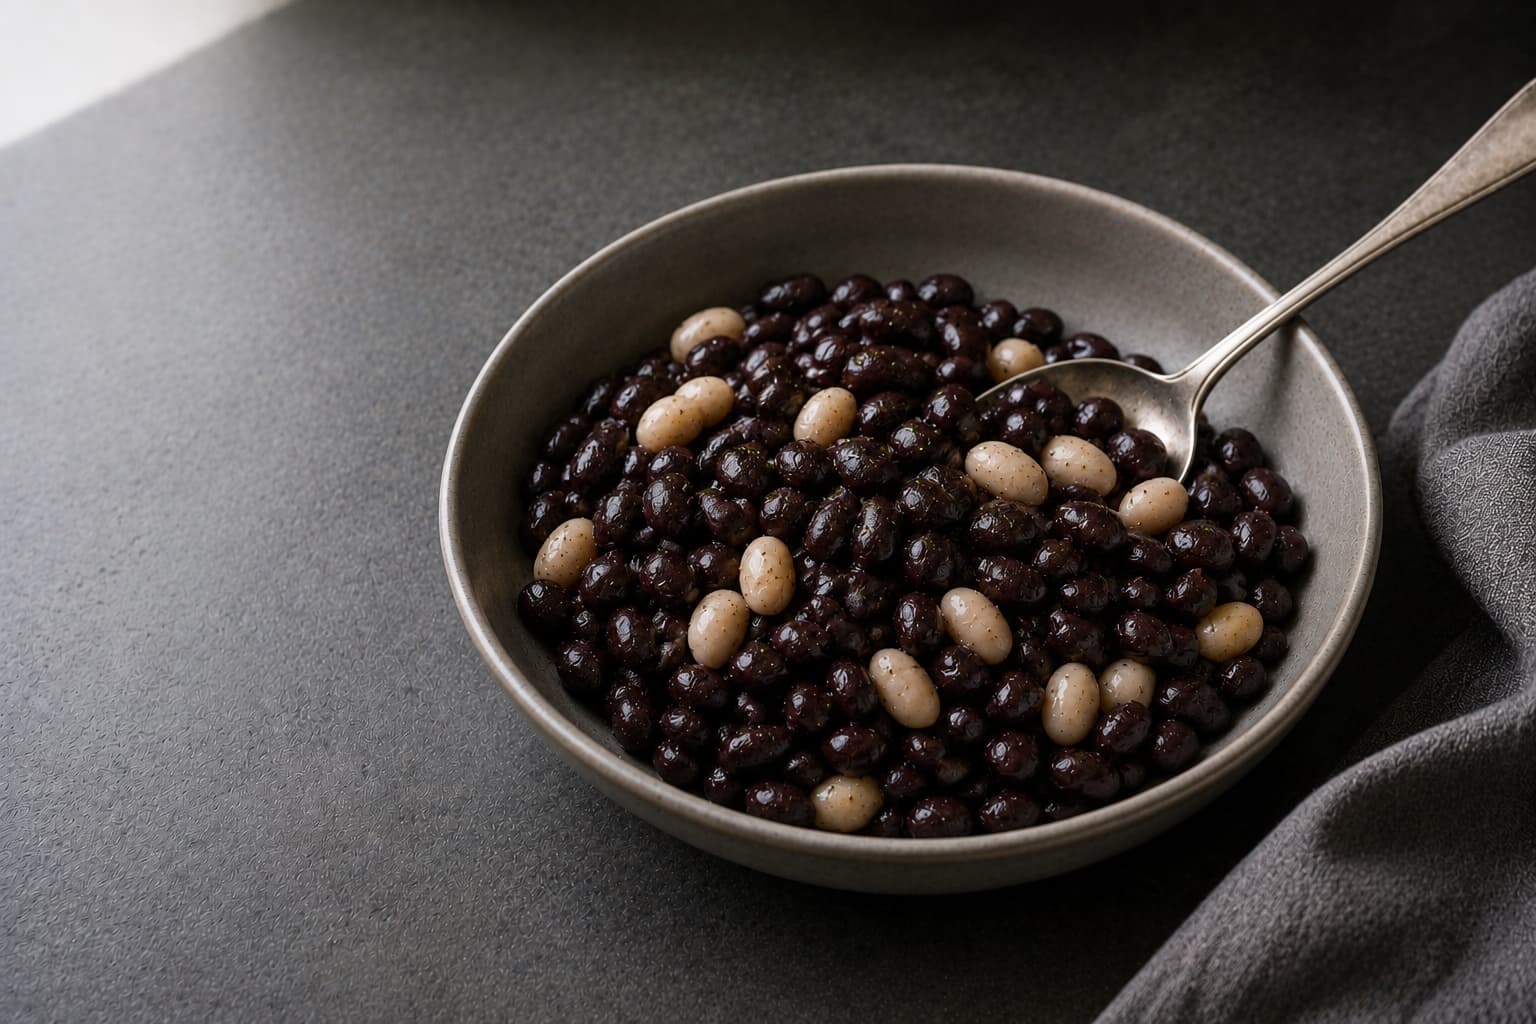
Why this page exists
Log a can of beans against the wrong record and the gap is not small. Raw dry chickpeas run 383 calories per 100 g. Canned chickpeas run 137. The 246-calorie difference is water joining the bean between the bag and the can, the same swap that turns a cup of dry rice into a cup of cooked, not an error in either record.
Ten USDA records carry this family, split cleanly into two states that never overlap. Seven are canned, sodium added, drained and rinsed, at a 130 g reference amount: black, pinto, kidney dark red, cannellini, navy, great northern, and chickpeas. Three are dry and unsoaked, at a 35 g reference amount: chickpeas, cannellini, and blackeye pea. Nothing on this page shows a bean mid-soak or freshly boiled at home, only the two ends of that process. The canned records show what's in the bowl after the can did the cooking and the colander did the rinsing, with sodium already down from whatever the can started at. The dry records show what a bean weighs before water touches it, useful for measuring what goes into the pot and useless for describing what comes out of it. Mixing the two means logging a raw weight against a cooked serving.
What is in a serving
Every figure below is scaled from the USDA record named at the bottom of this panel.
Serving basisgrams
100 gof Black, canned
- Calories
- 118 cal
- Protein
- 6.9 g
- Carbs
- 19.8 g
- Fat
- 1.3 g
| Nutrient | Per serving100 g | Per 100 greference |
|---|---|---|
| Calories | 118 cal | 118 cal |
| Protein | 6.9 g | 6.9 g |
| Carbs | 19.8 g | 19.8 g |
| Fat | 1.3 g | 1.3 g |
| Fiber | 6.7 g | 6.7 g |
| Sugar | not reportedUnavailable. This record does not report sugar. | not reportedUnavailable. This record does not report sugar. |
| Sodium | 218 mg | 218 mg |
Sugar is not reported on Black, canned.
A nutrient the record does not measure shows as — and never as 0. A zero here is a measured zero.
FDC 2644285USDA Foundation FoodsBeans, black, canned, sodium added, drained and rinsedPublished October 26, 2023
The records behind this page
One food family, 10 source records. The figures are per 100 g, which is the basis the USDA publishes and the only fair way to compare records whose servings differ.
| Record | Caloriescal | Proteing | Carbsg | Fatg | Fiberg | Sugarg | Sodiummg |
|---|---|---|---|---|---|---|---|
| Beans, Black, Canned, Sodium Added, Drained and RinsedFDC 2644285FoundationCannedShown by default | 118 | 6.9 | 19.8 | 1.3 | 6.7 | not reportedUnavailable. This record does not report sugar. | 218 |
| Beans, Pinto, Canned, Sodium Added, Drained and RinsedFDC 2644292FoundationCanned | 117 | 6.7 | 19.6 | 1.3 | 7.1 | not reportedUnavailable. This record does not report sugar. | 202 |
| Beans, Kidney, Dark Red, Canned, Sodium Added, Sugar Added, Drained and RinsedFDC 2644289FoundationCanned | 127 | 7.8 | 21 | 1.3 | 7 | not reportedUnavailable. This record does not report sugar. | 172 |
| Beans, Cannellini, Canned, Sodium Added, Drained and RinsedFDC 2644287FoundationCanned | 115 | 7.4 | 18.8 | 1.2 | 6.8 | not reportedUnavailable. This record does not report sugar. | 164 |
| Beans, Navy, Canned, Sodium Added, Drained and RinsedFDC 2644286FoundationCanned | 119 | 6.6 | 20 | 1.4 | 6.9 | not reportedUnavailable. This record does not report sugar. | 190 |
| Beans, Great Northern, Canned, Sodium Added, Drained and RinsedFDC 2644294FoundationCanned | 117 | 7 | 19.3 | 1.3 | 6.9 | not reportedUnavailable. This record does not report sugar. | 223 |
| Chickpeas (garbanzo Beans, Bengal Gram), Canned, Sodium Added, Drained and RinsedFDC 2644288FoundationCanned | 137 | 7 | 20.3 | 3.1 | 5.9 | not reportedUnavailable. This record does not report sugar. | 202 |
| Chickpeas, (garbanzo Beans, Bengal Gram), DryFDC 2644282FoundationDry | 383 | 21.3 | 60.4 | 6.3 | not reportedUnavailable. This record does not report fiber. | not reportedUnavailable. This record does not report sugar. | 9 |
| Beans, Cannellini, DryFDC 2644281FoundationDry | 345 | 21.6 | 59.8 | 2.2 | not reportedUnavailable. This record does not report fiber. | not reportedUnavailable. This record does not report sugar. | 0 |
| Blackeye Pea, DryFDC 2644284FoundationDry | 354 | 21.2 | 61.8 | 2.4 | not reportedUnavailable. This record does not report fiber. | not reportedUnavailable. This record does not report sugar. | 3 |
Logging beans without guessing
Rinse before you weigh, always. All seven canned records already reflect a drained-and-rinsed state, so the sodium figures in the table, from 164 mg for cannellini up to 223 mg for great northern per 100 g, are the after number. Rinsing an unrinsed can lowers its sodium by roughly 40 percentrinse, and that reduction never shows up in this dataset because every can here was measured after rinsing, not before. Drain the liquid and run the beans under water before you log them, or the label number is the one you're actually eating.
Fiber and protein move independently, so pick the record, not the category. Per 100 g, canned pinto carries the most fiber on this page at 7.1 g, canned chickpeas the least at 5.9 g. Protein runs a different order, kidney dark red highest at 7.8 g, navy lowest at 6.6 g. A tracker entry that just says "beans" averages away both numbers and hands you neither one accurately. Match the record to the can in your pantry.
The dry records carry almost no sodium, and that's a fact about the bean, not the recipe. Dry cannellini reports 0 mg per 100 g, dry blackeye pea 3 mg, dry chickpea 9 mg. None of that comes from a can. Whatever salt lands in the pot is yours to log separately, because no dry record here can account for it.
No conversion from dry weight to cooked weight lives on this page. This page has no matched record for the cooked, drained weight a home pot of beans lands at, only the raw dry weight going in and the canned drained weight of a different bean coming out. If you soak and boil dry beans yourself, weigh what leaves the pot on a scale and log against the matching canned record as the closest source-backed stand-in for its macros, rather than scaling the dry number by an unsupported yield.
Sugar is not measured on any of the ten records here, canned or dry. The table marks it unavailable rather than filling in a zero, and no bean on this page supports a sugar claim in either direction.
Where beans fit and where they don't
Fiber, where a normal portion actually moves the number. The pinto and kidney dark red records both clear 9 g of fiber at their 130 g RACC, and the table doesn't split that gram count into soluble and insoluble types. What each type does mechanically is covered in soluble fiber and resistant starch. What this page can prove is the total, and the total holds regardless of which canned variety is in the bowl.
Plant protein, stacked rather than claimed complete. Beans are a real protein source without being a complete one on their own, short on the sulfur amino acids that grains carry in surplus. Rice supplies what beans are short on, which is most of why the two show up together in dishes that predate any name for complementary protein. The mechanism sits in plant-based proteins. What this page can check is the protein total, 6.6 to 7.8 g per 100 g across the canned records, and that number does not move based on what sits next to it on the plate.
The Mediterranean pattern, as frequency rather than as an ingredient. Beans anchor that dietary pattern the way olive oil anchors its fat, a near-daily legume serving rather than an occasional side. That pattern is described in Mediterranean diet. One can of beans does not make a diet Mediterranean. The pattern is the habit, not the item.
Blood sugar, read through fiber and protein rather than a GI figure this page doesn't carry. Legumes tend toward a slower glucose rise than refined starches, largely a function of the fiber and protein sitting alongside the carbohydrate. Glycemic index covers the mechanism, and the ranked list of low-glycemic foods shows where beans sit against other carb sources. Log the fiber and protein columns on this page and let those numbers carry the argument instead of a GI number that isn't on it.
Where it doesn't fit. The same fiber load that makes beans useful for satiety is exactly what you don't want two or three hours before a hard session. Save the canned record for a recovery meal or a normal training day, not for the plate right before intervals.
The decision rule: log the canned record that matches your rinsed can, log the dry record only for what goes into the pot before cooking, and treat fiber and protein as the two numbers this page can prove. Sodium reduction from rinsing needs the citation, not the table, because every canned record here already reflects the after state.
Where it fits against a goal
Best fiber-to-sodium ratio, canned
130 g of Beans, Pinto, Canned, Sodium Added, Drained and RinsedFDC 2644292
- Protein
- 8.7 g
- Fiber
- 9.2 g
- Calories
- 152 cal
A 130 g RACC serving of canned pinto beans carries 8.7 g protein and 9.2 g fiber at 152 calories, the highest fiber figure among the seven canned varieties on this page. Rinse before you weigh it. The sodium figure in the table already assumes you did.
Lowest-sodium canned pick
130 g of Beans, Cannellini, Canned, Sodium Added, Drained and RinsedFDC 2644287
- Sodium
- 213 mg
- Protein
- 9.6 g
- Calories
- 150 cal
The cannellini record reports 213 mg sodium per 130 g serving, the lowest of the seven canned varieties here and 77 mg below the great northern record at the same weight. Protein still lands at 9.6 g, so the swap costs nothing on the macro side.
Dry weight for bulk cooking
35 g of Beans, Cannellini, DryFDC 2644281
- Protein
- 7.6 g
- Calories
- 121 cal
The dry cannellini record is raw and unsoaked, 121 calories and 7.6 g protein at the 35 g RACC. That is the weight before water and heat change it, not the weight of a finished pot. Measure dry beans against this record going in, and weigh what comes out separately.
Higher-fat chickpea swap
130 g of Chickpeas (garbanzo Beans, Bengal Gram), Canned, Sodium Added, Drained and RinsedFDC 2644288
- Fat
- 4 g
- Protein
- 9.1 g
- Calories
- 178 cal
Canned chickpeas run 178 calories and 4 g fat per 130 g, the highest of the seven canned records here. Protein holds at 9.1 g, so the extra calories buy little beyond a different texture in the dish.
Where this page stops short of the data
2 claims this page would like to make do not resolve to a record in the dataset. Each one carries the decision that was made about it.
Claim dropped
Per-100-g figures for beans cooked from dry, used in the half-cup protein and fiber comparison
No record supports this, so the page does not say it. There is no estimate standing in for the missing figure.
Cited from outside the dataset[^rinse]
Sodium removed by draining and rinsing canned beans, roughly 40 percent
SourceDuyff RL, Mount JR, Pope BT (2011), Journal of Culinary Science & Technology 9(2):106-112. Every canned record in the dataset is already drained and rinsed, so the reduction itself cannot be measured from the dataset, only the post-rinse result.
Methodology
Where the numbers come from
Every figure on this page is scaled from a per-100 g value in a USDA record by one shared function, so the numbers here and the numbers on a meal page that uses this ingredient cannot disagree. Values are rounded once, at the point of display.
- FDC 2644285Beans, black, canned, sodium added, drained and rinsedUSDA Foundation Foods
- FDC 2644292Beans, pinto, canned, sodium added, drained and rinsedUSDA Foundation Foods
- FDC 2644289Beans, kidney, dark red, canned, sodium added, sugar added, drained and rinsedUSDA Foundation Foods
- FDC 2644287Beans, cannellini, canned, sodium added, drained and rinsedUSDA Foundation Foods
- FDC 2644286Beans, navy, canned, sodium added, drained and rinsedUSDA Foundation Foods
- FDC 2644294Beans, great northern, canned, sodium added, drained and rinsedUSDA Foundation Foods
- FDC 2644288Chickpeas (garbanzo beans, bengal gram), canned, sodium added, drained and rinsedUSDA Foundation Foods
- FDC 2644282Chickpeas, (garbanzo beans, bengal gram), dryUSDA Foundation Foods
- FDC 2644281Beans, cannellini, dryUSDA Foundation Foods
- FDC 2644284Blackeye pea, dryUSDA Foundation Foods
Unavailable values
A nutrient a record does not measure is shown as unavailable and never as zero. Across the 405 records in this dataset, 165 report no fiber and 228 report no sugar, so the distinction is not a rare edge case. A zero on this page means the analysis measured zero.
Source coverage
This family has 2 recorded gaps between the editorial brief and the dataset, each shown above with the decision made about it.
Datasets
- USDA FoodData Central Foundation FoodsExport 2026-04-30 · 363 of 395 entries normalized
- USDA FoodData Central SR LegacyExport 2018-04 · 42 of 7793 entries normalized